


")


Table of Contents
INTRODUCTION
MoneyGram, a major cross-border remittance company, recently reports a quite quarter following its partnership with Ripple XRP.
Alexander Holmes, Chairman of MoneyGram at an earnings call for Q1 2020, revealed that it’s been a quiet quarter since the company partnered with the blockchain company Ripple XRP.
The partnership with the Nasdaq-listed money transfer company back in June 2019 had initial terms set to two years for a capital commitment of about 50 million USD over 24 months in exchange equity.
MoneyGram CEO commented that Ripple is yet to solidify its services or target market and the NASDAQ listed company won’t be leveraging in its core markets, but seek more growth in newer markets.
Also, in the news, Ripple’s XRP sales collapse to $1.75M as the company’s On-Demand Liquidity network grows in popularity. An increase in dollar value transactions using the ODL by over 294% shows a positive outlook towards the XRP and increase confidence among token holders.
In this post, we’ll analyze the monthly trend of XRP paired against the USD and the BTC. Let’s move on.
Technical Analysis
XRPUSD: Monthly
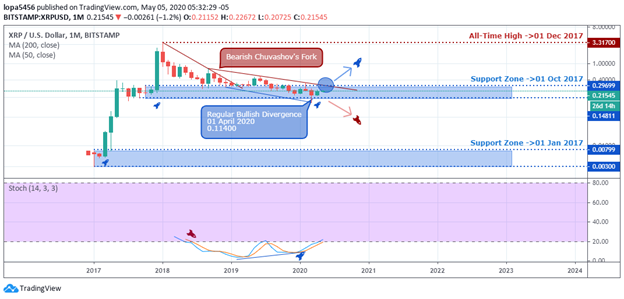
Monthly Resistance XTZUSD Levels: 3.3170
Monthly Support XTZUSD Levels: 0.29699, 0.14811, 0.00799, 0.0030
Ripple has been in a bearish trend since the number three cryptocurrency established its all-time high 3.3170 on 01 December 2017.
Bearish momentum starts to slow down upon entering the 01 October 2017 support zone (0.29699), while the bulls build up a regular bullish divergence of the stochastic oscillator.
A breakout above the second trend line of the Chuvashov’s fork after exiting the support zone will confirm the bottoming of the corrective phase and a surge in the XRP price to the upside.
On the other hand, if the bears force the XRP price to close below the 0.14811 support zone, we should expect a continuation and a prolonged bearish price slump.
XRPUSD: Weekly
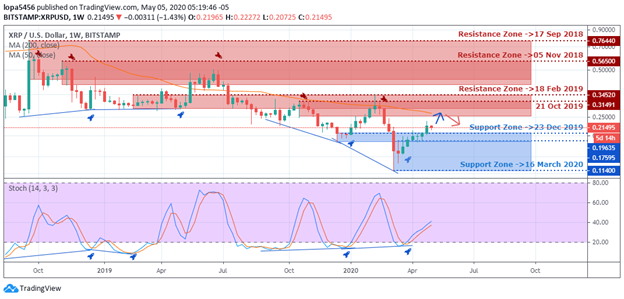
Weekly Resistance XTZUSD Levels: 0.76440, 0.56500, 0.34520, 0.31491
Weekly Support XTZUSD Levels: 0.1140, 0.17595, 0.19635
Looking at the weekly chart of the XRPUSD above, we noticed that the pair has been in a bearish trend since the 17 September 2018 resistance zone.
Notice how the bulls struggle to restore the XPR price higher but fail to the resistance zones after signaling a series of bullish divergence patterns.
Although the XRPUSD exchange rates have been rising for about a month now, we expect to see a slowing of the move upon entering the 20 October 2019 resistance zone (0.24715 – 0.31491).
XRPUSD: Daily
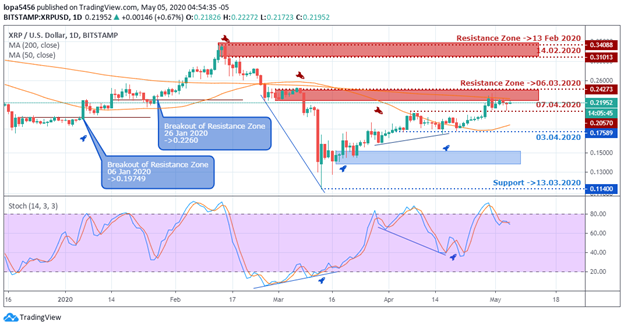
Daily Resistance XRPUSD Levels: 0.34088, 0.31013, 0.24273
Daily Support XRPUSD Levels: 0.1140, 0.17589, 0.20570
Aligning with the 06 March 2020 resistance zone, the MA-200 stops the bulls from further advancement after a price increase of about 107.0% from the 13 March support.
A breach of the resistance zone will confirm a continuation of the bullish trend towards the 13 February 2020 resistance zone this month.
XRPBTC: DAILY
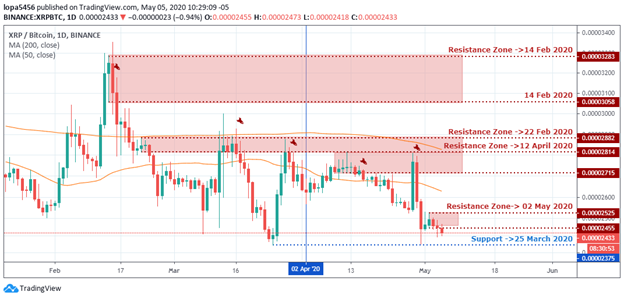
Daily Resistance XTZBTC Levels: 0.00003283, 0.00003058, 0.00002882, 0.00002814, 0.00002715, 0.00002715, 0.00002525, 0.00002455
Daily Support XTZBTC Levels: 0.00002375
After closing below the MA-200 from the 14 February 2020 resistance zone, the XRPBTC entered into a side-ways market structure and threatens to close below the 02 May 2020 resistance zone.
An increase in demand above the 0.00002455 level would send the XRP price towards the 22 February 2020 resistance zone.
Conclusion and Projection
The above analysis shows that the XRPUSD is getting close to bottoming and ready for a long term upward surge out of the significant monthly chart support zone.
The monthly trend outlook appears to soon stall upon entering into some crucial resistance area, so we may see a correction of the current bullish trend before the price resumes the upward move.
An exit of the 0.29699 resistance level from a monthly chart perspective confirms the bottoming of the XRPUSD corrective phase for a projected target at 0.7644 in the long term.


/(CBDC) Guide")
