


")


Cardano and its ADA token are fast becoming one of the breakout stars in the industry. Led by Charles Hoskinson, the blockchain smart contracting platform is said to be the next big thing in the industry, something confirmed when Weiss crypto ratings rated them higher than Chinese token EOS in their rankings.
Let’s take a look at the Cardano ADA native token and analyze this cryptocurrency set for big things. We have compiled a technical analysis below.
Table of Contents
Technical Analysis
ADA/USD: Monthly
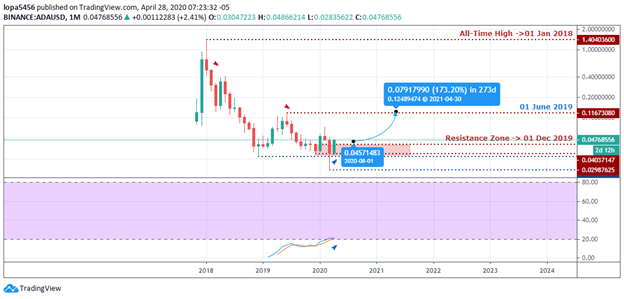
The above monthly chart of the ADAUSD shows the crypto pair coming out of the oversold area and getting ready for a bullish price surge. Though a regular bullish divergence pattern is signaled after the golden cross of the stochastic oscillator, we should also pay attention to a possible bearish divergence pattern if the pair goes back into the oversold area.
We should expect a change in polarity from bearish zone to bullish zone, if the month of April closes bullish above the 0.04037147 resistance area.
ADA/USD: Weekly
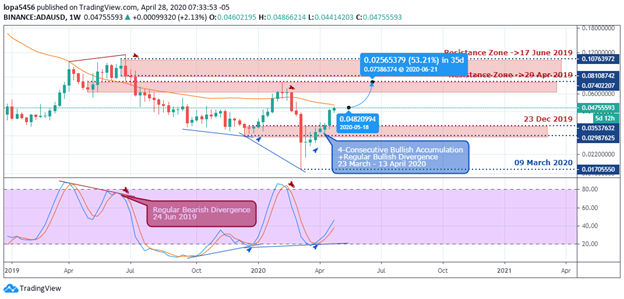
The above weekly chart shows the ADAUSD in a series of consecutive bullish closing candlesticks after forming a second regular bullish divergence pattern, and breaking above the 23 December 2019 resistance zone.
A break above the MA-50 (Orange) would send the ADAUSD exchange rate into the 17 June 2019 resistance zone, of course, after passing through the 29 April 2019 area.
If by any chance, the bears drive the price lower, the ADAUSD will find support at 23 December 2019 area as a result of polarity change.
ADA/USD: Daily
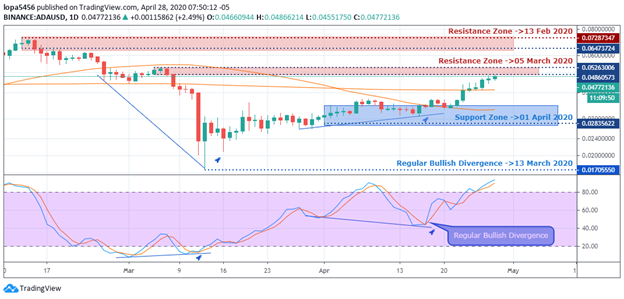
From the daily time frame, the ADA vs. USD hovers below the 05 March resistance zone and threatens to break above it after clearing the MA-200 and MA-50 hurdles.
Traders could enter a buy order at this point, placing their stop loss below the 01 April 2020 support zone. The 13 February 2020 may be a first price objective in a bullish trend.
ADA/BTC: WEEKLY
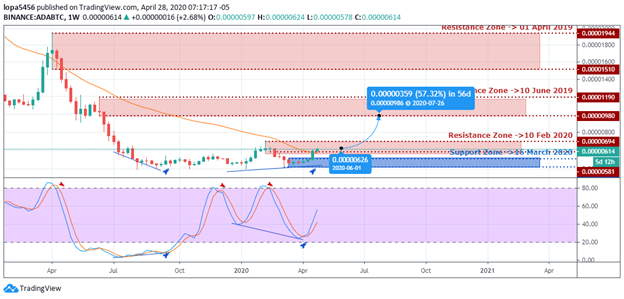
Traders now move funds from Bitcoin BTC to Cardano’s ADA, as shown on the weekly chart above.
A second regular bullish divergence and a break above bearish accumulation resistance now reinforce the optimistic outlook of the ADABTC.
The first price objective on the ADABTC is the 10 June 2019 resistance zone (0.00001190), followed by the 01 April 2019 resistance territory (0.00001944).
Conclusion and Projection
Both ADABTC and ADAUSD crypto pairs offer good setups to resume a bullish trend, and traders may decide to take a position in them.
If the bulls can confirm a support zone around the 0.04037147 and 0.02987625 range, we should get ready for a price projection of about 173.2% into the next resistance zone above on the monthly time frame of the ADAUSD.
However, to get there, the bulls will have to attain a target-1 on the weekly time frame after closing bullish into the 29 April 2019 resistance zone.
The ADABTC, on the other hand, will have to see bullish momentum drive the price beyond the 10 February 2020 resistance zone before heading towards the 10 June 2019 resistance zone (0.0000119 – 0.0000098) for a 57.32% gain.


/(CBDC) Guide")
