


")

")
Table of Contents
OKB growth in the platform token market
In the second half of 2018 where the crypto market was facing a bear run, stable coins issued by major exchanges were among the few that maintained a moderate growth. Ever since the beginning of 2019 when a new wave of initial exchange offerings (IEOs) hit the market, exchange tokens have greatly benefited from the situation: Binance Coin (BNB) jumped from USD 6.1 to USD25.7, recording a 318% increase; while OKB spiked 118% from USD 0.66 to USD1.44.
Among the exchanges that have issued their own tokens, recently OKEx has been extremely active. Since April, OKEx has joined forces with Prime Trust, a well-known US trust company, to issue a new stablecoin named OKUSD. The exchange then put OKB on Ethereum’s ERC-20 protocol and announced the launch their own public blockchain (the OKChain) on a testnet in June this year, extended lockup period of the remaining 700 million OKB, and the launch of OKB “Buy Back & Burn” scheme from May.
Comparing the innovative products on offer from other leading exchanges, OKEx apparently is ahead of its competitors (Huobi and Binance) by offering BTC futures trading since its inception. In terms of trading volume, the spot trading volume of OKEx is basically the same as that of Binance and Huobi; contract trading-wise, OKEx is constantly the highest globally and heading Bitmex. Its overall trading volume is also among one of the top exchanges globally.
Following the implementation of OKB ‘Buy-back & Burn’ program and the announcements about OKEx’s future development plan, the market could obtain more comprehensive data on OKB’s valuation. In this article, a general public chain valuation model will be first introduced, followed by an addition of differentiation assessment factors observed on other exchange token public chains. At last, the long-term valuation of OKB will be finalized by changing some of the model assumptions. It is hoped to verify whether OKB has been underestimated.
Public Chain Valuation Model
The core idea of this valuation model is to assess the value of public chain tokens through the measurement of supply and demand of public chain tokens. We will specifically focus on using panel data of currently leading public chains as a variable statistical basis and consider the level of significance of the estimation model.
Currently, the demand for public chain tokens can be categorized into two types: (a) demand for investment, including the demand for holding dividend income and trading income; (b) demand for usage, which mainly refers to the use of tokens in exchange for products or services on a public chain network (including services such as voting, governance, etc. in a broad sense). We express the total demand function of public chain tokens here as:
T = T1 + T2 (1)
T represents the total demand of a token, T1 represents the investment demand and T2 refers to the usage demand. In this report, we calculate the demand volume in USD.
The investment demand T1 is measured by the trading volume of the token in the market (ExVolume):
T1 = H1 (ExVolume) (2)
The usage demand T2 is expressed by the ecological value of the public chain. Ecological value refers to the chain network’s ability to provide products and services:
T2 = H2 (Value) (3)
The ecological value of a public chain is measured by the number of active addresses on the chain and DApp single transaction amount:
- Number of active addresses: According to Metcalfe’s Law, the value of a network and the number of nodes are correlated. On a blockchain network, the number of active addresses can be used to replace the number of nodes.
- DApp single transaction amount: the single transaction amount of DApp is equal to its total transaction amount/trading quantity. This indicator can comprehensively measure the activeness and value creation ability of a DApp on public chain. The “DApp quantity” factor was once adopted to measure previously. However, this could not achieve an ideal level of significance.
So, the below formula has been drawn:
Value = Y(Address^2, DApp) (4)
T2 = H3 (Address^2, DApp) (5)
“Address” represents the active addresses in the blockchain network while ‘DApp’ represents the single transaction amount of DApp. If equation (2) and (5) are added to (1), we will get:
T=H(ExVolume,Address^2, DApp) (6)
Let’s look at the supply of the token. Since a token’s circulation volume is determined by formula in advance and is not affected by random variables, we can use the constant ‘M’ to indicate the supply volume within any given time, and use ‘V’ to represent the token’s circulation speed (how many times that token was exchanged within that timeframe). Therefore, the total circulation volume of the token trading within the given time is ‘MV’, and the current trading price is ‘P’.
Now consider the total demand of T. When the market clears, the total transaction size of the buyer is USD T, which means for every dollar corresponding trade, we need ‘1/P’ token to complete the transaction. Therefore:
MV = T/P (7)
P = F {ExVolume, Address^2, DApp} (8)
When Volume > 0 and DApp > 0, F (·) > 0 and the above 4 variables are the extension functions related to F. So we can include time and individual dimension on the basis of formula (8) (add time stamp ‘t’ and individual identifier ‘I’ on the lower right of the variables). After taking the logarithm of formula (8), we can get:
Dln Pit = α * Dln ExVolumeit + β * Dln Addressit2 + γ * DAppit (9)
The formula on the right side of the equation represents the token’s daily average profit, therefore the token’s yield model is:
rit = α * Dln ExVolumeit + β * Dln Addressit2 + γ * Dln DAppit (10)
The following is the quantitative estimation of the parameters of the above model. We selected data of 3 major public chains between Dec 1, 2018 and May 1, 2019 as samples (Ethereum (ETH), EOS and Tron (TRX)), using token’s daily price, exchange’s daily trading volume, daily active address number, DApp daily transaction volume and DApp daily transaction number as indicators; of which DApp single transaction amount equals to DApp daily transaction volume divided by DApp daily transaction number. (Data sources: Coinmerics and SpiderData)
After obtaining the logarithm and differential, the token price has obtained a yield rate function. Since the sample data is long panel data, when selecting the measurement model, we need to consider the related first-order autocorrelation problems within the group (economic variables including general price, yield rate, etc.). We used FGLS to estimate and got the following results:
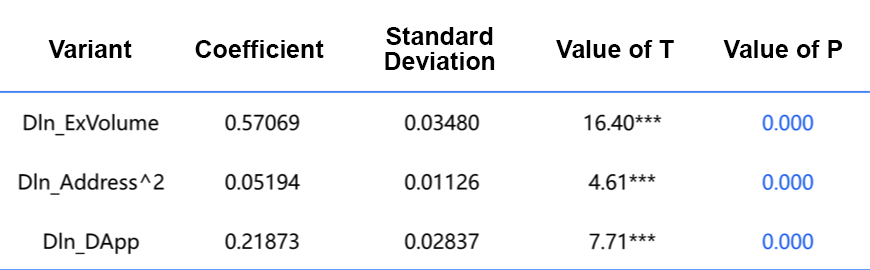
Table 2. Model Measurement Result
Note: ***represents a significance level of 0.01; **represents a significance level of 0.05; *represents a significance level of 0.10
From the above table, when level of significance is 1%, the coefficients of Dln ExVolume, Dln Address^2 and DlnDApp are positive and have passed through t-test. This indicates that the exchange trading volume, active addresses square root and DApp single transaction can all significantly affect the token’s yield rate ‘r’. The estimation model of public token yield rate is:
rit = 0.57069 * Dln ExVolumeit + 0.05194 * Dln Addressit2 + 0.21873Dln DAppit (11)
Furthermore, at ‘t’ time, the token price can be calculated by the following formula:
OKB Valuation and Estimation
According to general public chain valuation model, first we need to predict the key data, such as the trading volume of OKB, number of active addresses on the OKChain and DApp single transaction amount, etc. to obtain the demand volume of ‘T’.
Forecast of OKB Trading Volume on Exchange
Looking at OKB’s historical trading volume, since January 2019, OKB has gradually moved on from the bearish market in the second half of 2018 and its trading volume recorded a rapid increase, the average daily trading volume has climbed from USD 8 million at the beginning of 2019 to over USD 50 million.
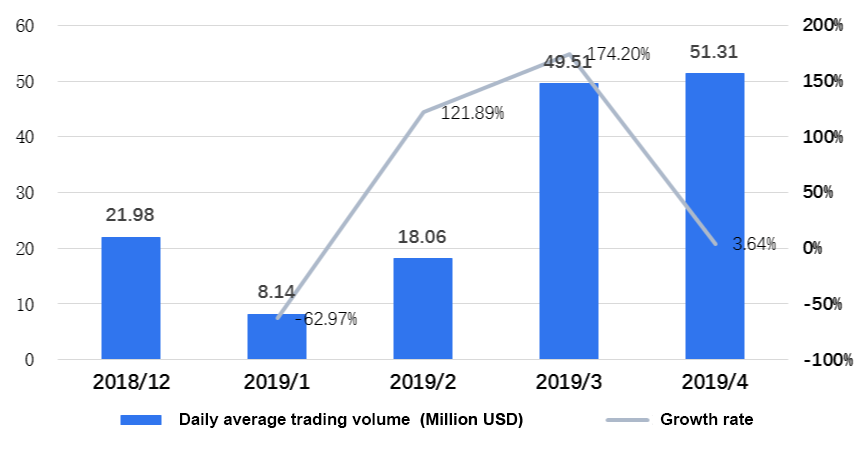
Figure 1: OKB average daily trading volume from December 2018 to April 2019
The two most important factors affecting OKB’s future trading volume are the new constructions build when OKChain mainnet is live and the overall development of the crypto market. First, we can look at the trading volume changes before and after the EOS, TRON and BNB mainnet was live:
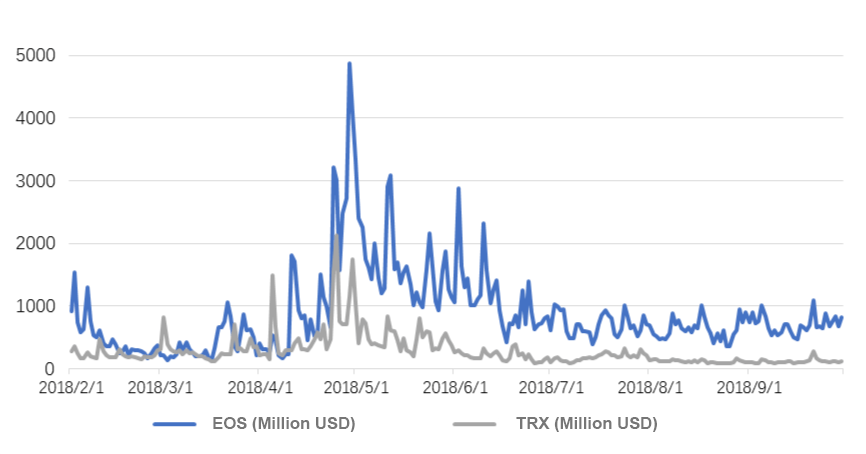
Figure 2: Average daily trading volume of EOS and ETH between February to September, 2018
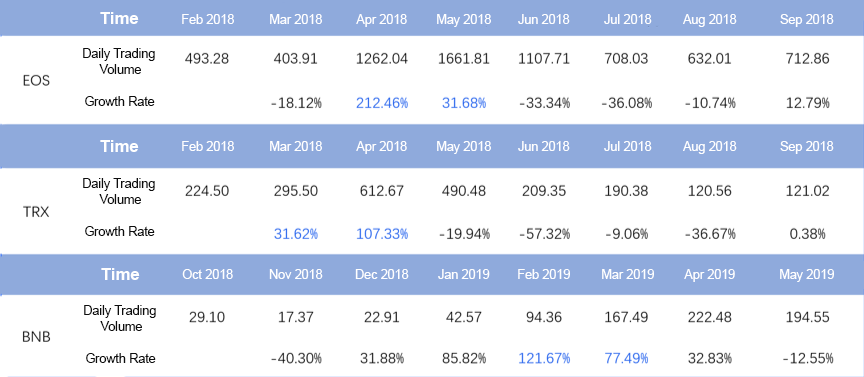
Table 3. Average daily trading volume of EOS, TRX and BNB
From the above table, the trading volume of BNB, EOS and TRX achieved tremendous growth 1-2 months before the mainnet was live, reaching 212.46%, 121.67% and 107.33% respectively. Since the current market value of OKB is lower than the above public chains, and the growth rate in the future is still uncertain, we took an average growth rate that is lower than the samples’ (100-150%) to predict the increase in trading volume of OKB due to major events.
Moreover, according to the long-term development plan OKEx disclosed, we believe that the OKChain mainnet goes live, OKDEx goes live, super nodes and the OKUSD-based DeFi ecosystem will significantly affect OKB trading volume.
On the other hand, according to the digital asset market historical data, the overall market trend does pose a significant impact on market trading volume. For example, in the above table, since the market was bearish during May to September 2018, the trading volume of EOS and TRX had evidently declined continuously.
We predict that the digital asset market is now at the end of a bear market, and will gradually experience economic recovery and prosperity before the end of 2020. The overall market trading volume and the trading volume of major public chains will show an upward trend. By comparing large amount of historical data, we can get the expected value of trading volume changes during the recovery stage and booming stage (as shown in Table 4).
Through comprehensive analysis of the above two factors, we have the following assumptions for the growth of OKB trading volume, expected growth (Table 4) and OKB’s expected average daily volume growth (Table 5).
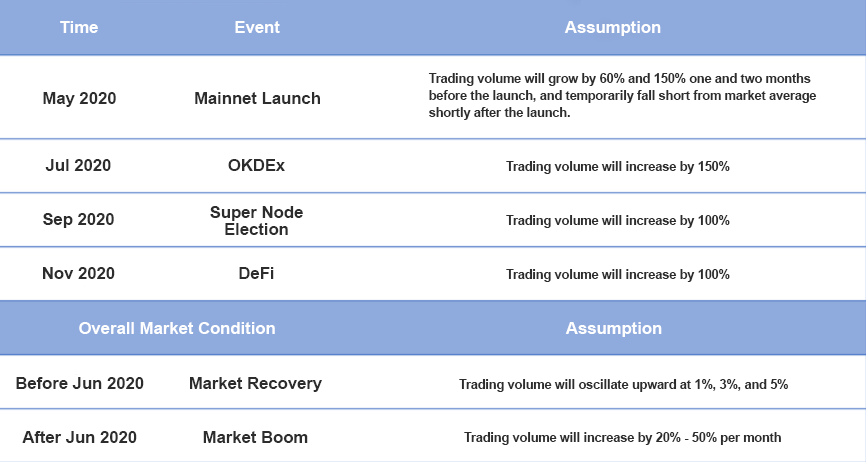
Table 4. Assumption and expected growth of exchange trading volume of OKB
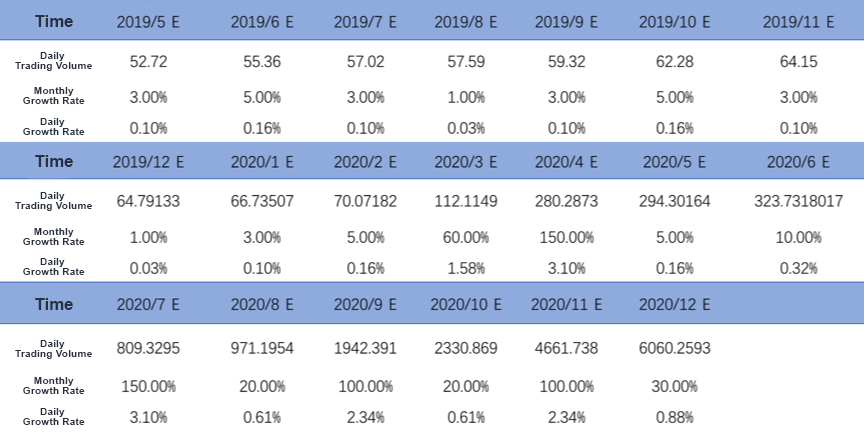
Table 5. OKB average daily trading volume assumption (Unit: USD 1 million)
OKB Usage Demand Analysis
According to OKEx official announcement, OKB will be the only native token on the OKChain and can be used in a variety of applications. Based on the prediction model mentioned earlier, the use value of OKB will increase exponentially along the OKChain active numbers and the DApp single transaction volume. Its core is dependent on OKChain technological performance, DApp ecological construction capability and user operation capacity.
We will compare and analyze its key capabilities with the leading public chain to predict the development level of OKChain’s mainnet.
Evaluation of the feasibility and creativity of OKChain technology solutions.
OKChain adopts the multi-chain sharding scheme and the improved PBFT fast consensus algorithm, which can vastly improve the scalability and transaction processing capabilities to achieve a faster consensus. It can effectively process shards information exchange and decoupling transactional dependencies across fragmented transactions through specially designed blocks and cross-sharding structure. It can also randomly determine block orders through the new verifiable random shuffling function, and the sharding amount base on dynamic adjustment. It can be understood that the OKChain carries out a new generation of optimization innovation based on the two most forward-looking storage expansion plans of Cosmos multi-chain expansion and ETH status sharding expansion.
It will also focus on solving the biggest technical bottleneck of the current two solutions – how to random block verification and the balance of sharding. From a theoretical perspective, the OKChain solution is considered one of the most innovative and feasible options among the public chains. From the engineering implementation perspective, since the code of OKChain is not an open source, we can’t evaluate its quality and progress.
It can only be judged by the technical background and papers released from its development team. According to a survey, there are more than 50 senior engineers in the OKChain development team, with experience from world’s leading internet companies including Microsoft, Google, Oracle, etc. Currently, they have published 5 technical papers. The team is at the middle to top tier among the world’s top blockchain technology development companies. OKChain technical solution evaluation: ETH≈OKB>EOS>TRX (ETH’s state sharding scheme is still under development and yet to see significant progress
Evaluation of OKChain DApp Ecosystem Layout
Financial DApps
In April, OKEx announced a partnership with Prime Trust, a well-known US-based trust company, to jointly launch the stablecoin OKUSD, which will run on OKChain.
In the same month, OKEx also announced a plan to develop a decentralized exchange (DEx) based on OKChain.
Recently, OKEx unveiled a partnership with Caspian, a world-renowned asset management platform.
It is obvious that this series of actions reflects OKEx’s strategic layout on building a financial ecosystem on top of OKChain.
Financial applications are the backbone of Ethereum’s DApp ecosystem. Since 2019, Ethereum has seen a significant growth in DApp activities and trading volume, which are directly related to the stablecoin application MakerDAO. This is because of the development of stablecoins which allow various types of mortgage lending applications and options futures trading applications to thrive into scale on-chain.
Comparatively, the stability of the USD-backed OKUSD is much higher than that of DAI (the stablecoin for MakerDAO applications), which can facilitate its rapid construction of various financial applications. Moreover, since OKEx has established partnerships with a growing number of mainstream asset management platforms, It will open up the capital inflow channels from traditional financial markets and is expected to achieve explosive growth in financial DApp transactions. On top of this, at the end of 2018, OKEx has completed its investment in Securitize, a world’s leading STO platform, and acquired a number of US Broker-dealer licenses, making it possible to carry out compliant on-chain financial businesses.
In addition, taking into account the strong synergy and complementarity between OKEx’s exchange business and other digital asset financial applications, the ranking on financial ecosystem layout is:
OKB > ETH > EOS > TRX
Gaming DAPP
Second to the largest DApp category of finance, the gaming DApp has seen a positive growth on Ethereum and EOS, particularly the gambling DApps on EOS.
In contrast, OKEx has no significant action in the gaming area. The only news is that OKEx has invested in Cocos, a star project backed by a game engine manufacturer. In theory, this investment can help OKChain accelerate its expansion into the gaming ecosystem. However, as the extend of this specific investment is still unclear, it is unlikely to make any sound prediction on the company’s development.
Ranking on gaming DApp ecosystem: EOS > ETH > TRX > OKB
Cross-chain DAPP Collaboration
EOS has recently announced a launch of collaboration with other public chains in June this year. It is generally believed that EOS will develop a cross-chain system that supports DApps on other public-chains. Moreover, with the star project Cosmos coming into operation, cross-chain interoperability will become an important direction for public chain development. The first public chain that supports multiple public-chain open access protocols and transference between interfaces will take the lead in the next round of development race.
Comparatively, while OKChain features a multi-chain solution and EOS will launch a similar development plan, the other two major public chains have no remarkable actions in this regard.
Moreover, given that OKEX has recently launched several collaborative research projects with traditional financial institutions, such as banks, and governmental platforms, it seems the company is planning to launch a compliant blockchain solution business for commercial use on top of its exchange business. If OKChian can further achieve the cross-chain interoperability between other blockchains that are with mature commercial usages, it will definitely further its growth.
Ranking on cross-chain collaboration: OKB > EOS > ETH ≈ TRX
Evaluation of User Operations Capability
According to public data, OKEx has 20 million registered users worldwideIt is conservatively estimated that the number of active users is about 1 million based on a 5% rate.
Thanks to the rapid development of lightweight DAPP browsers, the DAPP user threshold is further reduced. Considering that OKEx’s trading users and the investors of blockchain financial applications are highly coincident, even if a conservative user conversion rate of 10% is adopted, the estimated OKChain active user base is still around 100,000, much larger than the current number of active users on ETH, EOS and TRX.
Given that OKEx already owns traffic resources and marketing teams in many markets around the world, once the development of DApps starts, the growth of OKChain’s user base is likely to surpass Ethereum’s due to the former’s advantage in “centralized” services.
Ranking in user operations capability: OKEx > EOS > TRX > ETH
On the whole, the development potential of OKChain is relatively higher than the current three major public chains. The relevant data of other public chains can be used valuate OKB.
The changes of the three major public chains in the six months after launch are taken as reference to predict the relevant indicators of OKB, as shown below:
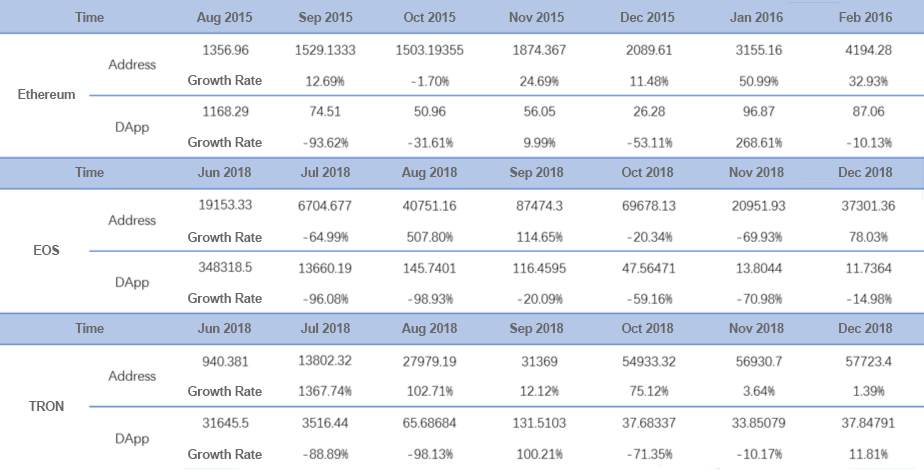
Table 7. Changes in number of addresses after mainnet launch and DApp single transaction amount (USD)
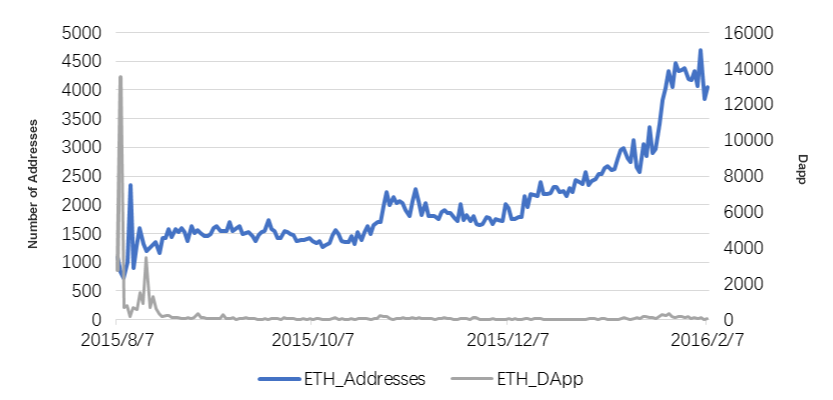
Figure 4: Changes in number of addresses on three public chains and DApp single transaction amount in first six months after mainnet launch
Based on the above data analysis and combined with the general trend of the overall recovery growth in the digital assets trading market, OKChain daily average active address and DAPP single transaction amount are estimated as follows:
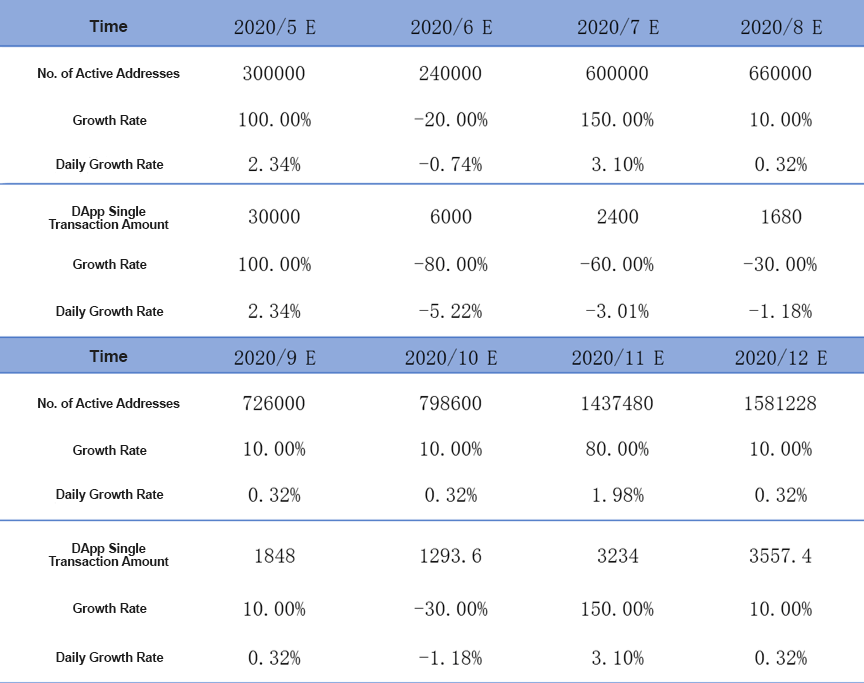
Table 8. Estimation of number of OKChain daily average active address and DApp activeness
Based on the data in Table 5 and Table 9, using the formula (11), the average daily rate of return and the monthly average rate of return of OKB in the next one and a half years can be estimated, as shown in the following table:
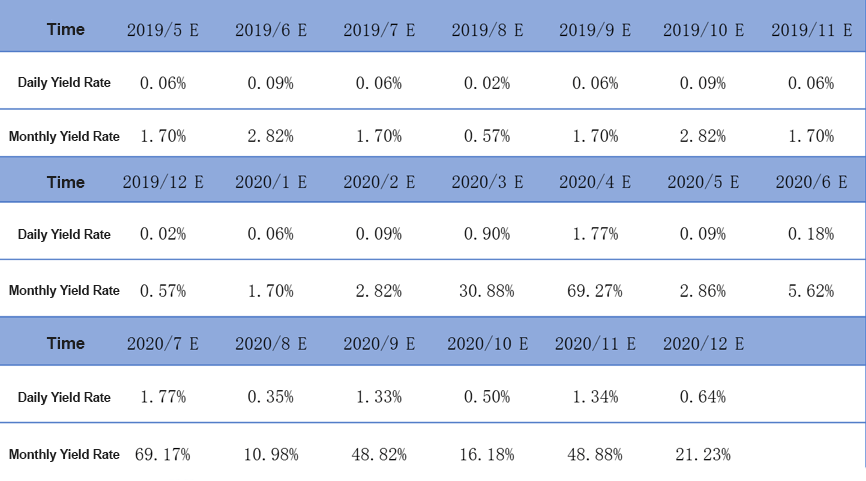
Table 10. OKB rate of return estimation
As this general public chain valuation model does not take into account the off-chain usage of OKB (such as transaction fee deduction, deposit for Prime Investors Program, OKB holding requirement for OK Jumpstart subscription, etc.), the estimation is relatively conservative.
Assumption Relaxed: OKB Supply Change Caused by Bay-Back & Burn Program
In the above token valuation model, a strict assumption is made – the supply of tokens remains unchanged over a period of time.
However, the supply of some platform tokens has continued to decline due to buy-back programs that are linked to platforms’ revenue. Therefore, when analyzing the impact of the buy-back program on the price of a platform token, the above assumption must be relaxed.
In Equation 7, it is clear that the price of a token is inversely proportional to its supply. On other words, the smaller the supply M of a token, the higher the price. Therefore, we can rewrite Equation (11) to Equation (12), in which Dln M represents the change rate of token supply.
rit = 0.57 * Dln ExVolumeit + 0.052 * Dln Addressit2 + 0.22 Dln DAppit – Dln Mit (12)
According to official information data, there is currently a total of 300 million OKB circulating in the market, and the unlocking time of the non-circulating 700 million OKB has been postponed from 2020 to 2022. On May 10, 2019, the OKB Buy-back & Burn Program was launched. According to the official announcement, 30% of the spot market transaction fee is used to buy back and burn the circulating OKB. Based on this condition, the price change of OKB under the Buy-back & Burn Program can be predicted as follows.
As the amount of OKB bought back and burned every week is determined by the transaction fee revenue of OKEx’s spot market, in order to predict the monthly income of OKEx’s spot trading business, it is necessary to first predict the future growth of the digital asset investment market, and then use the overall market growth to estimate the revenue of the exchange. As an economic system that follows the same economic laws as other industries do, the digital asset market also undergoes a similar business cycle. Specifically, a cycle period of Bitcoin starts from a reward halving to another, about 4 years for a cycle. While we are now in the recovery phase of the third cycle, the next boom is expected to take place after the third Bitcoin reward halving begins in the second half of 2020. As such, the Bitcoin market condition in the recovery phase of the second cycle is taken as reference.
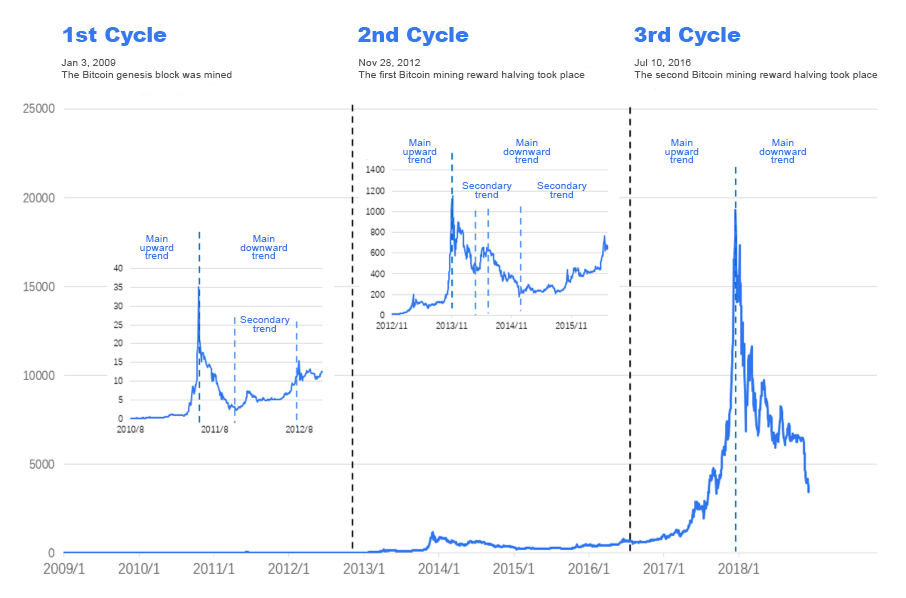
Figure 5: Commercial cycle of digital asset market
As shown above, in the second cycle, the recovery phase begins in September 2015 and ends in July 2016, with a time span of approximately 10 months. As shown in Table 11, from September 2015 to July 2016, the monthly compound growth rate of Bitcoin’s average daily trading volume is 21.55%. It is conservatively estimated that in the recovery phase of the third cycle of the digital asset market, the monthly compound growth rate of market trading volume is 15%; in the second half of 2020, the market is expected to enter a boom, and its monthly compound growth rate is foreseen to reach 35%. To simplify the analysis, let’s assume that OKEx’s business revenue will also increase by 15% and 35%. (In general, the market growth rate of a top industry players is often greater than the overall average growth of the market)
According to official announcement, the total value of OKB bought back and burned in the first week of May is about USD$750,000, so it can be predicted that the total buy-back value in May will be about $3 million, and the growth of OKB coin burning amount will synchronize with the overall market growth. At this point, it is predicted that the change in the amount of OKB bought back and burned in the future will be as shown in Table 12.
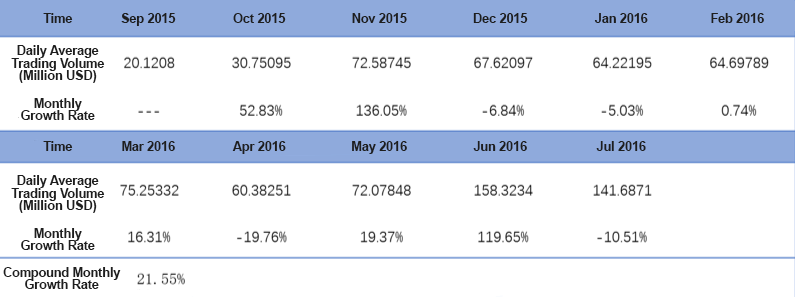
Table 11: Bitcoin daily trading volume from August 2015 to July 2017
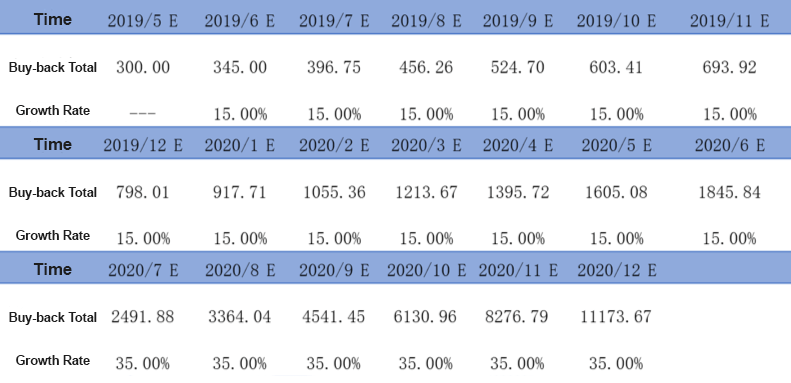
Now, let’s calculate the impact of the Buy-back & Burn Program on OKB price. According to official announcement, OKEx will buy back OKB every 3 months from June 2019. In order to better reflect the impact of price changes on the OKB buy-back amount, here let’s assume the buy-back takes place on a monthly basis, and the OKB buy-back unit price is the forecast price for this month. According to formula (12), the results are as follows.
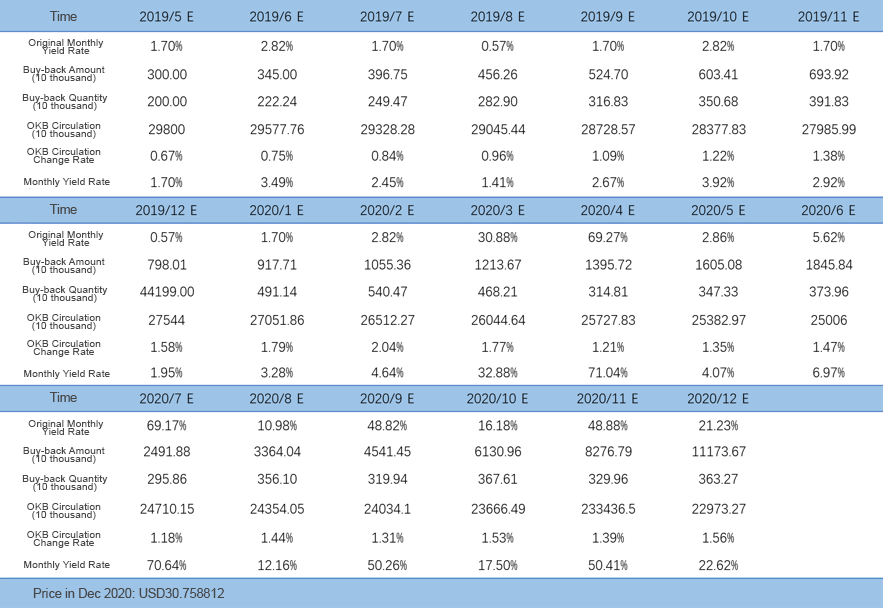
Table 13: OKB price prediction (Unit: USD)
After the above modelling and estimation, it is expected that by the end of 2020, the price of OKB will reach USD30.75 and its market capitalization will be about USD7.068 billion. There is a significant growth lag in OKB at this stage, and the potential of price growth needs to be further released. In the next round of market recovery and boom, OKB is likely to become one of the fastest-growing assets in the market.


/(CBDC) Guide")
