
Enjin has long been an industry leader in mobile wallets, but what some may not know is the company’s commitment to all things blockchain gaming. The company has partnered with gaming heavyweights like Minecraft, to bring crypto-related gaming to the masses- often through its native token ENJ.
The gaming industry is an area where blockchain has come to stay. Catching the attention of large corporations and independent developers. With national lockdowns from the COVID-19 pandemic, gaming has never been more popular, and may users are seeing the benefits of blockchain gamings decentralization and open-source nature.
Users can own and freely exchange in-game assets without intermediaries. Cross-game asset exchanges using the ERC-1155 multi-token standard developed by the Enjin project, which can be simultaneously issued and sent in large quantities.
In this post, we’ll analyze and identify the significant support and resistance levels established by key technical chart and candlestick patterns on the ENJ/USD and ENJ/BTC charts, following a top-down multiple time frame analysis.
Technical Analysis ENJ
ENJ/USD: Monthly


The Enjin coin ENJ vs. USD is in an ascending triangle formation on the above monthly time frame as the token forms higher highs on 01 November 2018 (0.02004919), and a break out of support zone set on 01 September 2019 (0.09204009 – 0.04810542).
The resistance zones established on 01 January 2018 and 01 March 2019 form the horizontal level at 0.2524608, which the bulls have to push through to set a new all-time high.
Notice the MACD indicator exiting the oversold area for a second time. Traders should look to take their first profit around the 0.25246048 resistance going forward into Q2 2020.
A monthly candlestick price close below the 0.4810542 support zone should confirm the rejection of the bullish campaign where the bears resume control of the token price.
ENJ/USD: Weekly

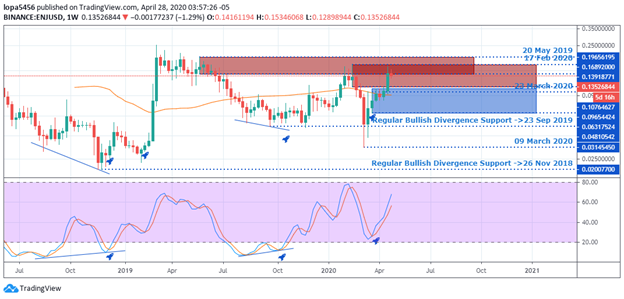
Taking a step down to the weekly time frame, regular bullish divergence patterns set up supports on 26 November 2018 (0.02007700), and 23 September 2019.
The ENJ/USD price enters an intersection between two resistance zones, forming a double top chart formation, and hinting a likely slowing of buying pressure to the upside.
At this point, we suggest that traders close out a fraction of their open long trades and wait for a correction back into the support zone for re-entry into the bullish trend.
ENJ/USD: Daily

The ENJ/USD is one of the few altcoins that clearly trades above the MA-200 and MA-50. Its bullish trend from a daily chart perspective was flagged by a regular bullish divergence on 13 March 2020, setting support at 0.03145450.
After finding support on the 11 April 2020 support zone, the ENJ/USD exchange rate surged higher and now trades within the 17 February 2020 resistance zone.
A price close above the 17 February resistance zone will confirm the bullish upbeat and consequently attaining new highs.
ENJ/BTC: WEEKLY

Let’s round up by analyzing the ENJ vs. Bitcoin BTC from a weekly time frame view.
Looking above, an increase in demand for ENJ coin set the ball rolling for a bullish trend that led to a price increase of about 759.84% after the bulls set up support zone on 19 Nov 2018 (0.00000704 – 0.00000577).
The bulls again found support at the first support zone and set new support around the 0.00000798 and 0.00000615 range where the price has already bounced off.
Conclusion and Projection
Following the above analysis, it is evident that there’s a massive demand for the ENJ coin. However, as traders and investors, timing our entry and picking the crypto pair to trade is essential for us to attain maximum profits.
With that said, we favor buying the ENJBTC over the ENJUSD as the resistance zone that may hamper the bullish trend is still farther away. That does not mean we can buy into the ENJUSD, but we’ll have to wait for the analyzed significant resistance levels to be breached before entering a long position.
For the ENJ/USD we project a 100.45% from the current price (0.00001964) at press time. Meanwhile, the ENJ/USD is projected at 50% from the publication price at 0.138753710.


")