

Chainlink has made a big impact since its launch, and one element of their company is their Oracles and their native token, LINK.
According to Michael Anderson, an early bird into Chainlink Link investment, and co-founder of Framework Venture, Link could Surge higher beyond the $25 mark and perhaps overtake Ethereum ETH. As a result, we decided to analyze the LINK token. Let’s move on to analyze the charts of the LINK USD from a top-down approach and also compare Link’s performance on the LINKBTC chart.
Table of Contents
LINK Price Analysis
LINKUSDT: Monthly


Monthly Resistance LINKUSDT Levels: 4.9762, 4.5826
Monthly Support LINKUSDT Levels: 2.0657, 1.4612, 1.3600, 0.3504
Chain Link Link vs. USD established a new all-time high in March at 4.9762, surpassing the previous 01 June 2019, an all-time high. The top-performing altcoin later pierced below but not closing beyond the 01 September 2019 support zone 1.4612, formed by a breakout of bearish accumulation resistance (2.0657).
The opening of the new month 01 May 2020 signals confidence to enter long in the LINKUSD, as the crypto pair finds support at the support zone (2.0657 – 1.4612).
Mr. Anderson’s directional bias though perceived to be exaggerated may play out in Q2 2020.
LINKUSDT: Weekly
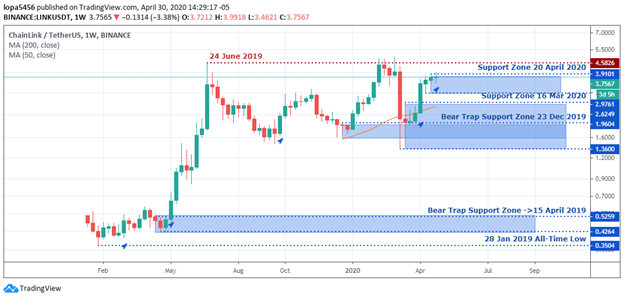
Weekly Resistance LINKUSD Levels: 4.5826, 3.9101
Weekly Support LINKUSD Levels: 2.9761, 2.6249, 1.9604, 1.3600, 0.5259, 0.4264, 0.3504
A view from the weekly time frame shows the LINKUSD forming higher lows and failure of bearish pressure to evade the support levels.
Again, on the weekly time frame, we get early bullish entry to the upside after the pair closed with a bullish candlestick within the 23 December 2019 and 16 March support zones.
If the bulls fail to break above the 4.5826 with the bullish closing price on the weekly time frame, and the higher support zones give in to bearish pressure, we should expect the crypto pair to head south, towards the 15 April 2019 support zone. However, the formation of bullish accumulation patterns in recent weeks indicates optimism toward a price breach of the resistance level.
LINKUSDT: Daily

Daily Resistance LINKUSDT Levels: 4.9762, 4.5333
Daily Support LINKUSDT Levels: 3.4437, 3.1212, 2.1373, 2.0372, 1.9543, 1.7620, 1.3600
The LINKUSDT exchange rates plummet by roughly 70.7% following a regular bearish divergence and setting of resistance zone on 05 March 2020 (4.9762 – 4.5333).
The bearish momentum forced the LINK price below the MA-200 and later used the level as resistance.
Later support zones set on 18 March 2020, and 28 March 2020, point to an increase in demand for the cryptocurrency, bringing the rates back above the MA-50 and MA-200 levels.
As the pair finds support on the 14 April 2020 support zone, we expect a price surge into the 05 March 2020 resistance going forward.
LINKBTC: WEEKLY

Weekly Resistance LINKBTC Levels: 0.00056739, 0.00052572
Weekly Support LINKBTC Levels: 0.00036341, 0.00032999, 0.00024131, 0.0000580, 0.00002276, 0.000010
The LINKBTC crypto pair has been in a bullish trend-setting higher troughs, starting from 11 December 2017.
A break of bearish accumulation of 03 December 2018, established a second support zone and drawing in new investors. The level again served as support, after exiting the oversold area above the zone.
The recent bearish resistance zone on 13 April 2020 shows that control is returned to the BTC (bears), and they now drive the exchange rate towards the 30 March 2020 support zone.
LINKBTC: DAILY

Daily Resistance LINKBTC Levels: 0.00056937, 0.00052572
Daily Support LINKBTC Levels: 0.00033864, 0.00032999, 0.00030144, 0.0002890, 0.00028181, 0.00025938
The bears, from a daily chart overview, signaled opposing bearish divergence setups on 04 March 2020, and recently on 09 March 2020.
These setups show an increase in demand for Bitcoin BTC over Chain Link (Link), while we eye the 05 April 2020 support zone as entry to enter back into a bullish trend.
Conclusion and Projection
From our analysis so far, Chain Link is favored over the USDT. However, traders may want to buy Bitcoin BTC as a hedge in the short term while waiting for the LINKBTC to exit the oversold area on the daily time frame.


")